ML · Analytics
Customer Segmentation and Retention Analysis
The problem
Any business with repeat customers has the same three questions: who is about to leave, who is worth the most, and where should a limited retention budget go? The answers are usually sitting in the transaction history, unused. This project works through all three on two years of real, messy sales data (about 1M rows and 5,900 customers) and ends with something a marketing team can act on.
How I approached it
- 01
Clean. Removed duplicates, rows with no customer and data-entry errors. Kept cancelled orders, treating a cancellation as behaviour worth studying, not noise to delete.
- 02
Segment. Scored each customer on how recently, how often and how much they buy, then grouped them twice: once with business rules and once with a clustering algorithm. The two methods agreed, and statistical tests confirmed the groups differ for real.
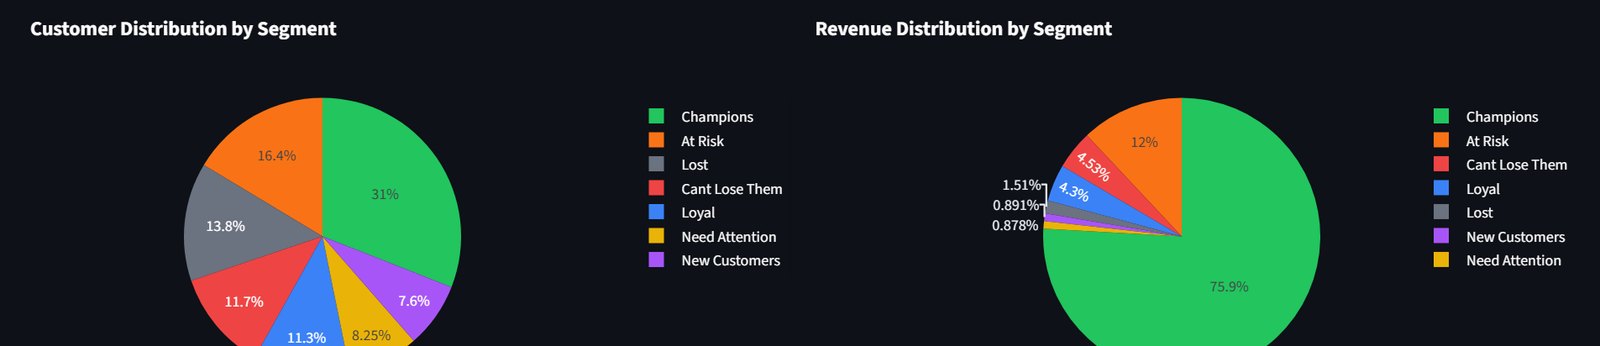
Customers by segment (left) against revenue by segment (right). - 03
Predict. Trained models to answer two forward-looking questions per customer: will they buy again in the next six months, and how much will they spend if they do?
- 04
Decide. Crossed the two predictions, risk of leaving against future value, so every customer lands in one of four groups, each with a recommended action.
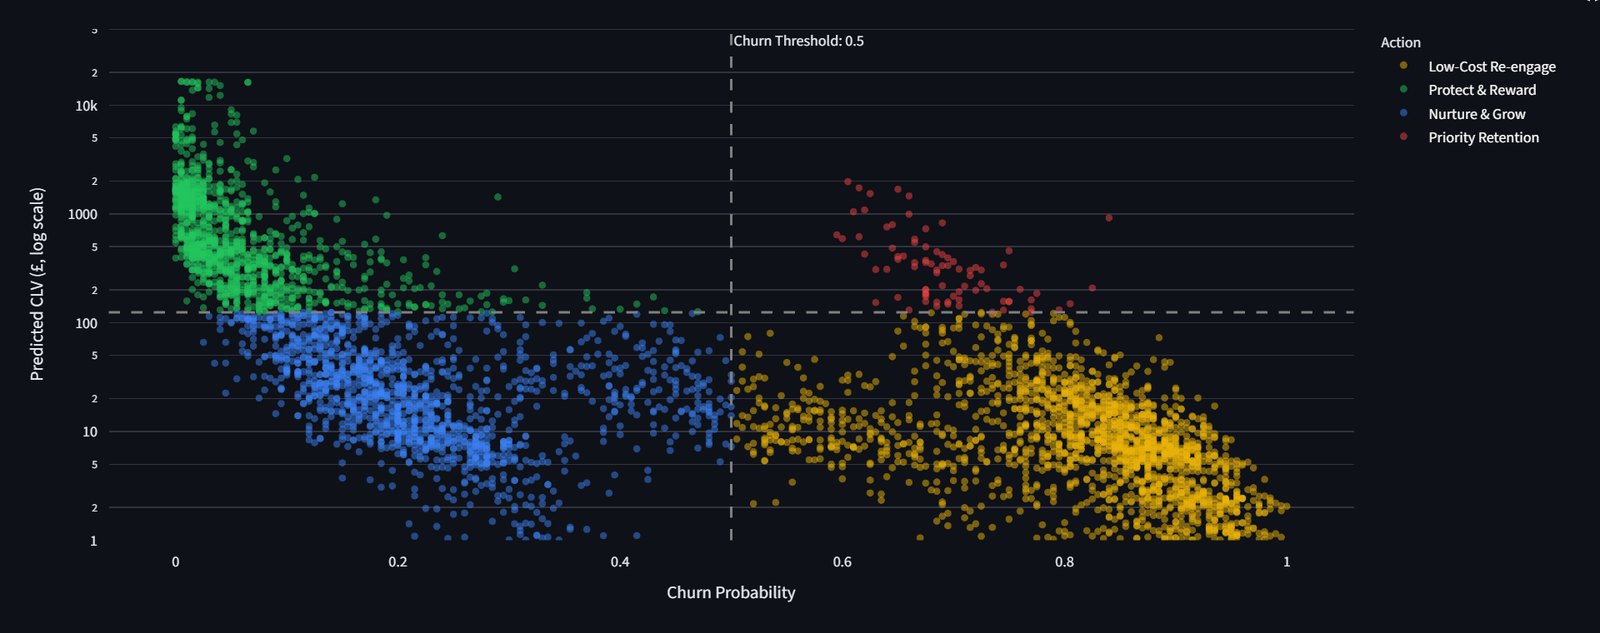
Every dot is a customer. The dashed lines split them into the four action groups. - 05
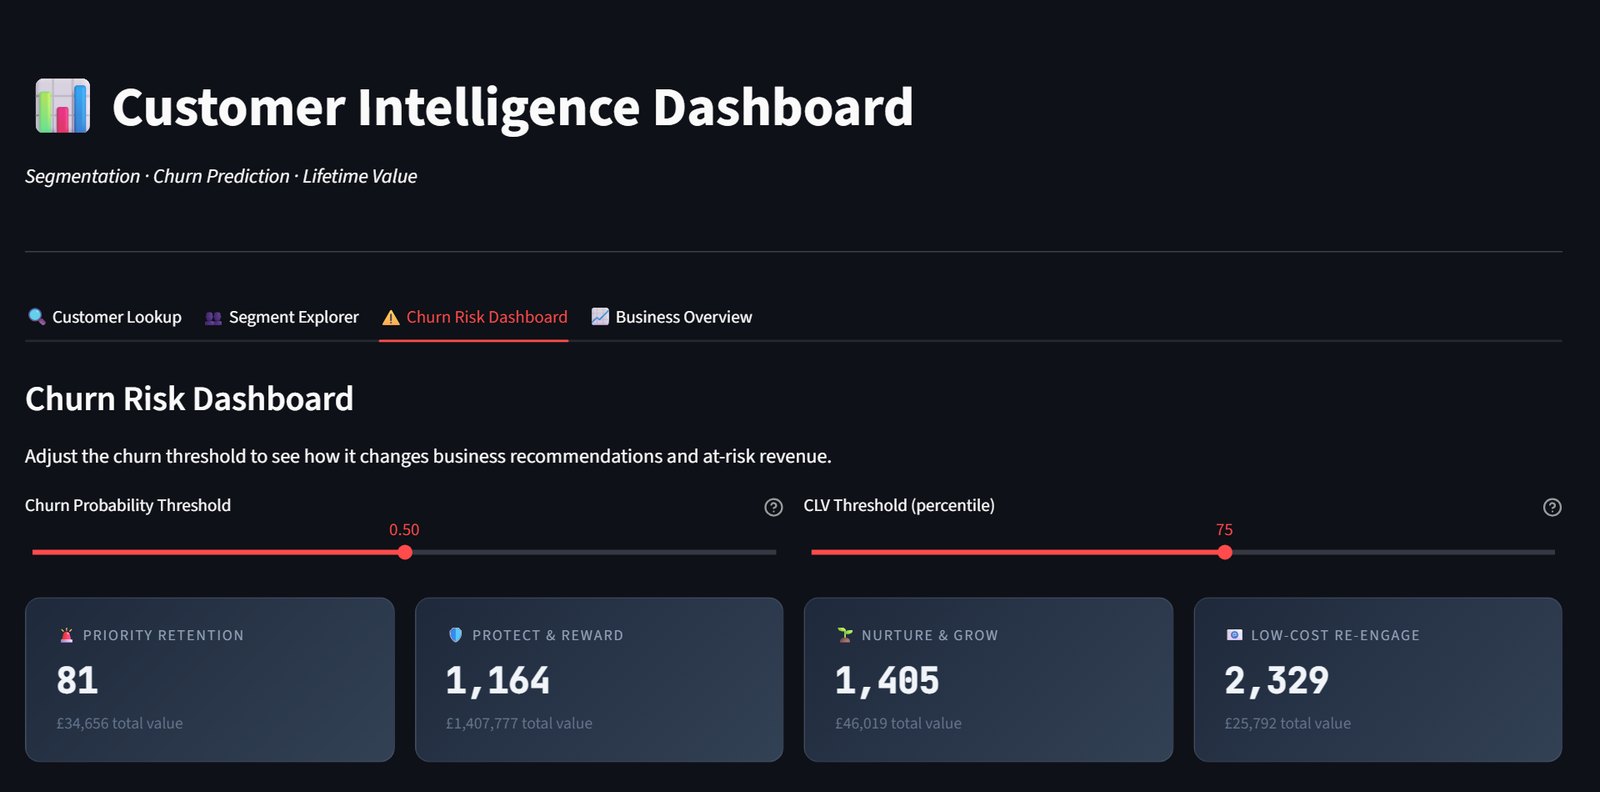
Ship. Put it all in an interactive dashboard: look up any customer, explore a segment, or move the thresholds and watch the groups change.
The hard part
My first churn model scored a perfect 1.0. That was the warning sign. I had defined a churned customer as one with no purchase in 180 days, then handed the model "days since last purchase" as an input, so it was reading the answer straight off the question. I rebuilt the pipeline around time: learn from each customer's first 18 months, then check whether they came back in the following 6. The score fell to 0.80, which is a number I can defend.
Results
A third of customers bring in three quarters of the revenue
The top segment is 31% of customers and 76% of revenue. Losing one of them costs far more than losing an average customer, so that is where retention effort pays.
The Champions segment Share of customers31%Share of revenue76%Customers who cancel orders are more likely to stay
This was the surprise. Customers who had cancelled at least one order left far less often than those who never had. A cancellation is a sign of an engaged customer, not an unhappy one.
Share of customers who did not return Never cancelled58.8%Has cancelled33.6%Time since the last order is the clearest warning
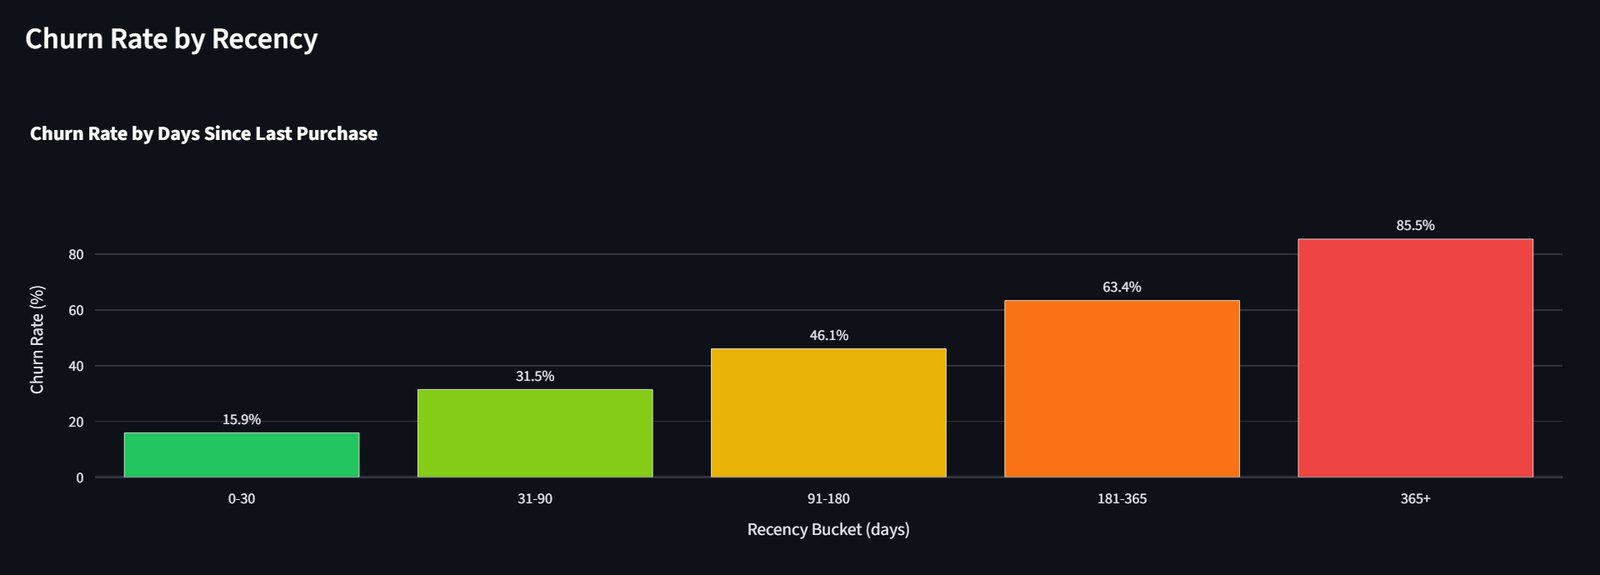
Of customers who bought in the last 30 days, 16% left. Past a year of silence it is 86%. The model spots about 7 in 10 departing customers while there is still time to act.
Every customer gets a next step
1,164 high-value, low-risk customers to protect and reward (about £1.4M of predicted spend). 81 valuable customers at real risk, worth a personal call. 1,405 to nurture and grow. 2,329 low-value customers likely to leave, who get low-cost, automated outreach.
Future improvements
The spending model ranks customers by value well, but its exact figures are rough (off by about £945 on average), because it only sees transactions. Browsing, marketing and product-category data are the obvious things to add next.
- Python
- pandas
- scikit-learn
- XGBoost
- SHAP
- SciPy
- Plotly
- Streamlit